OpenTelemetry Instrumentation: Adding Observability to Your Services
What OpenTelemetry Is
OpenTelemetry (OTel) is a CNCF project providing vendor-neutral APIs, libraries, and tools for collecting telemetry — metrics, traces, and logs. The vendor neutrality is the point: instrument once, route to any compatible backend.
OTel emerged from the merger of OpenCensus and OpenTracing in 2019. By 2025, it’s the dominant standard. Datadog, New Relic, Grafana, Honeycomb, and most other observability platforms accept OTel data natively.
The Three Pillars
Traces: spans representing operations, linked into causal chains across services. Tells you what happened in what order across the distributed system.
Metrics: aggregated time series. Tells you rates, error counts, and latency distributions.
Logs: structured events. Tells you what specific things happened.
OTel covers all three; in practice, traces and metrics are where most OTel deployment effort goes. Logs are increasingly handled by OTel too but still often go through separate pipelines.
Auto-Instrumentation
For Java, Python, Node.js, .NET, and Ruby, OTel ships auto-instrumentation: attach an agent (Java), import a wrapper (Python, Node), or enable a build flag, and common libraries are instrumented automatically. HTTP servers, HTTP clients, database drivers, and message queues produce spans without code changes.
Auto-instrumentation gives you 80% of the value for 5% of the effort. It’s the right starting point for almost every service.
Manual Instrumentation
Auto-instrumentation captures generic operations. Custom business logic — ‘process this order,’ ‘apply this discount rule’ — needs manual spans.
The manual API is straightforward: get a tracer, start a span, do work, end the span. Add attributes for business context (order_id, customer_segment) to make spans queryable.
The trap: instrumenting too much. Every span has a cost in storage and sampling. Instrument the operations that matter for debugging; don’t instrument every function call.
Collectors and Pipelines
The OpenTelemetry Collector is a separate service that receives telemetry from instrumented applications, processes it (filters, transforms, samples), and exports it to backends.
Run a collector as a sidecar or as a cluster service. It centralizes sampling and routing logic, so you can change backends or sampling strategy without redeploying every service.
Related Reading
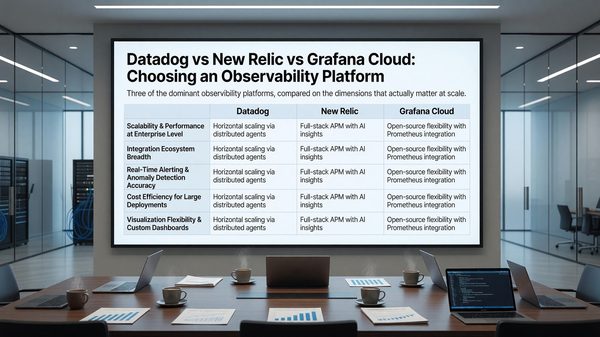
- See our deeper guide at /developer-tools/datadog-vs-new-relic-vs-grafana-cloud/.
Semantic Conventions
OTel semantic conventions standardize attribute names across instrumentations: http.method, http.status_code, db.system, etc. Using the conventions means dashboards built for one service work for any service that emits standard attributes.
Custom attributes are fine for business context (order_id, customer_tier, feature_flag_state). For anything covered by semantic conventions, use the standard name.
Distributed Tracing in Practice
The value of distributed tracing scales with system complexity. For a monolith with two backend dependencies, traces are nice-to-have. For a system with twenty microservices and asynchronous workflows, traces are how you understand anything.
The instrumentation tax is real. Adding tracing context propagation across async boundaries (queues, scheduled jobs, callbacks) requires explicit work. The payoff comes the first time you debug a multi-service latency issue and the trace shows exactly where the time goes.
Pipeline Design
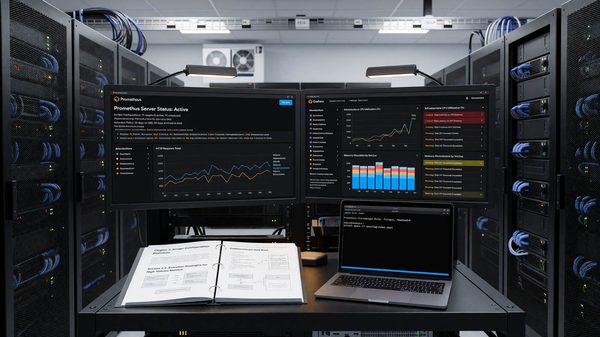
A typical OpenTelemetry pipeline: application emits OTel data, OTel Collector receives it (often as a sidecar or daemon), Collector processes and filters, Collector exports to one or more backends.
Why the Collector instead of direct application-to-backend: it decouples instrumentation from observability vendor. Switch backends by changing Collector config; applications don’t redeploy. The Collector also handles sampling, filtering, and enrichment in a central place.
For high-volume environments, a tiered architecture works well: agent Collectors on each host (or as DaemonSets in Kubernetes) and gateway Collectors that aggregate before export. The pattern handles scale that a single Collector can’t.
Migration From Vendor SDKs
Migrating from Datadog, New Relic, or other vendor SDKs to OpenTelemetry happens incrementally. Both can run in parallel during transition. OTel data exported to the same backend appears alongside vendor SDK data.
Strategy: instrument new services with OTel from day one. Migrate existing services opportunistically (during other instrumentation changes). Don’t force big-bang migration unless there’s a specific reason.
End state: all services on OTel, with backend choice flexible. The portability is the goal even if you stay with the same backend long-term — vendor lock-in via instrumentation is a meaningful business risk.
Productivity and Developer Experience
Developer experience research consistently finds that small friction adds up. The minute spent every time you switch tasks because the tool is slow, the moment of confusion every time a command doesn’t work as expected — these compound across days and weeks.
The investment in good tooling pays back. Engineers with well-tuned environments routinely outperform engineers in default environments by meaningful margins, especially on tasks that involve switching context or doing repetitive actions.
Standardize where it helps (shared dotfiles, dev container baselines, agreed-on tool choices) and let individuals customize where it doesn’t (editor preferences, prompt designs, keyboard layouts). The right balance varies by team.
Adoption and Onboarding
New tools succeed or fail in onboarding. A tool with great long-term value but a steep initial curve gets abandoned before the value materializes. A tool with limited value but smooth onboarding becomes the default forever.
Successful tool adoption usually includes: an internal champion who’s already proficient, paired learning sessions for newcomers, and explicit time set aside for the learning curve.
Forcing adoption without these supports doesn’t work. Engineers who feel forced revert to familiar tools as soon as oversight ends. Voluntary adoption with good support generates lasting change.
Tool Evaluation Process
New developer tools arrive constantly. Without a process for evaluation, teams either adopt every shiny new thing or rigidly reject change. Both extremes hurt.
A working evaluation process: small pilot with one or two engineers, sharing of findings, broader trial if the pilot succeeds, decision point on team-wide adoption. The full cycle takes weeks to months depending on tool scope.
Document the why behind tool choices. The tools change; the reasoning often persists. Future evaluators benefit from understanding what was tried and what didn’t work.
Personal Setup and Sharing
Each engineer’s personal setup evolves over years. The best setups combine team-standard tools with personal customizations that match individual working styles.
Sharing setups within the team accelerates everyone. A monthly ‘show your setup’ session, internal blog posts on tooling discoveries, or pair-programming where engineers see each other’s environments all transfer tacit knowledge.
Dotfile repositories with documentation make this concrete. Teams that share their environments openly find that productivity gains spread organically across the group.
Building Your Setup Over Time
Developer tooling evolves continuously. The setup that worked two years ago has gaps now; the setup that’s perfect today will feel dated in two years. Treating personal tooling as an ongoing investment, not a one-time setup, yields the best long-term results.
Practical rhythm: review and update tooling every six months. Try one new tool each quarter. Document what works for your own future reference. The accumulated experimentation builds a setup that fits your actual workflows.
The community matters here too. Tool authors and power users share insights via blog posts, conference talks, and social media. Following a few voices in your tooling space surfaces ideas you’d otherwise miss.
Most importantly, optimize for your actual work, not for theoretical best practices. The tools that other engineers love may not fit your style; that’s fine. The goal is making your daily work flow better, not adopting trends.
The compounded effect of small tooling improvements over a career is significant. The investment now pays back for years to come.
Key Takeaways
The most important point throughout this guide: practical engineering decisions depend on specific context. Best-practice recommendations are starting points, not destinations. The right answer for your team depends on your scale, your existing tooling investment, your team’s experience, and the specific constraints you face.
Three principles worth carrying forward regardless of specific tool choices. First, measure what you change. Engineering improvements without measurement become folklore — claims without evidence. Track the metrics that show whether interventions are working.
Second, default to simpler architectures and tools. Complexity has cost. Each additional moving part is something to monitor, debug, upgrade, and eventually replace. Choose the simplest thing that meets your actual requirements, not the most sophisticated thing you could build.
Third, invest continuously in the boring foundations. Reliable CI, good observability, sensible access controls, and clear documentation pay back across every project. Skipping these for short-term feature velocity accumulates debt that eventually consumes the velocity it was supposed to enable.
The teams that operate well over the long term are usually not the teams with the most exotic tooling. They’re the teams with disciplined fundamentals, deliberate decision-making, and continuous incremental improvement.
Frequently Asked Questions
Where do I start?
Auto-instrumentation for one critical service, exported to your existing observability backend. Iterate from there.
Does OTel replace my current agent (Datadog, New Relic)?
Can, but doesn’t have to. Most backends accept OTel data alongside their native agents. Gradual migration is supported.
How much sampling should I do?
Tail-based sampling (decide after the trace completes, based on errors or latency) is the right default for production. 100% sampling rarely works above modest scale.
What about logs?
OTel logs are maturing. Most teams still use a separate logging pipeline (Loki, Elasticsearch, Splunk) and correlate with traces via trace IDs in log messages.