Datadog vs New Relic vs Grafana Cloud: Choosing an Observability Platform
The Three-Player Race
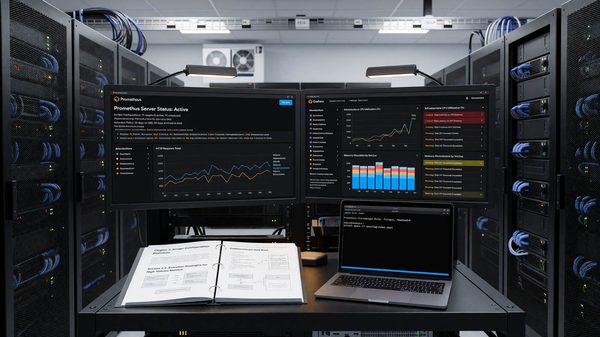
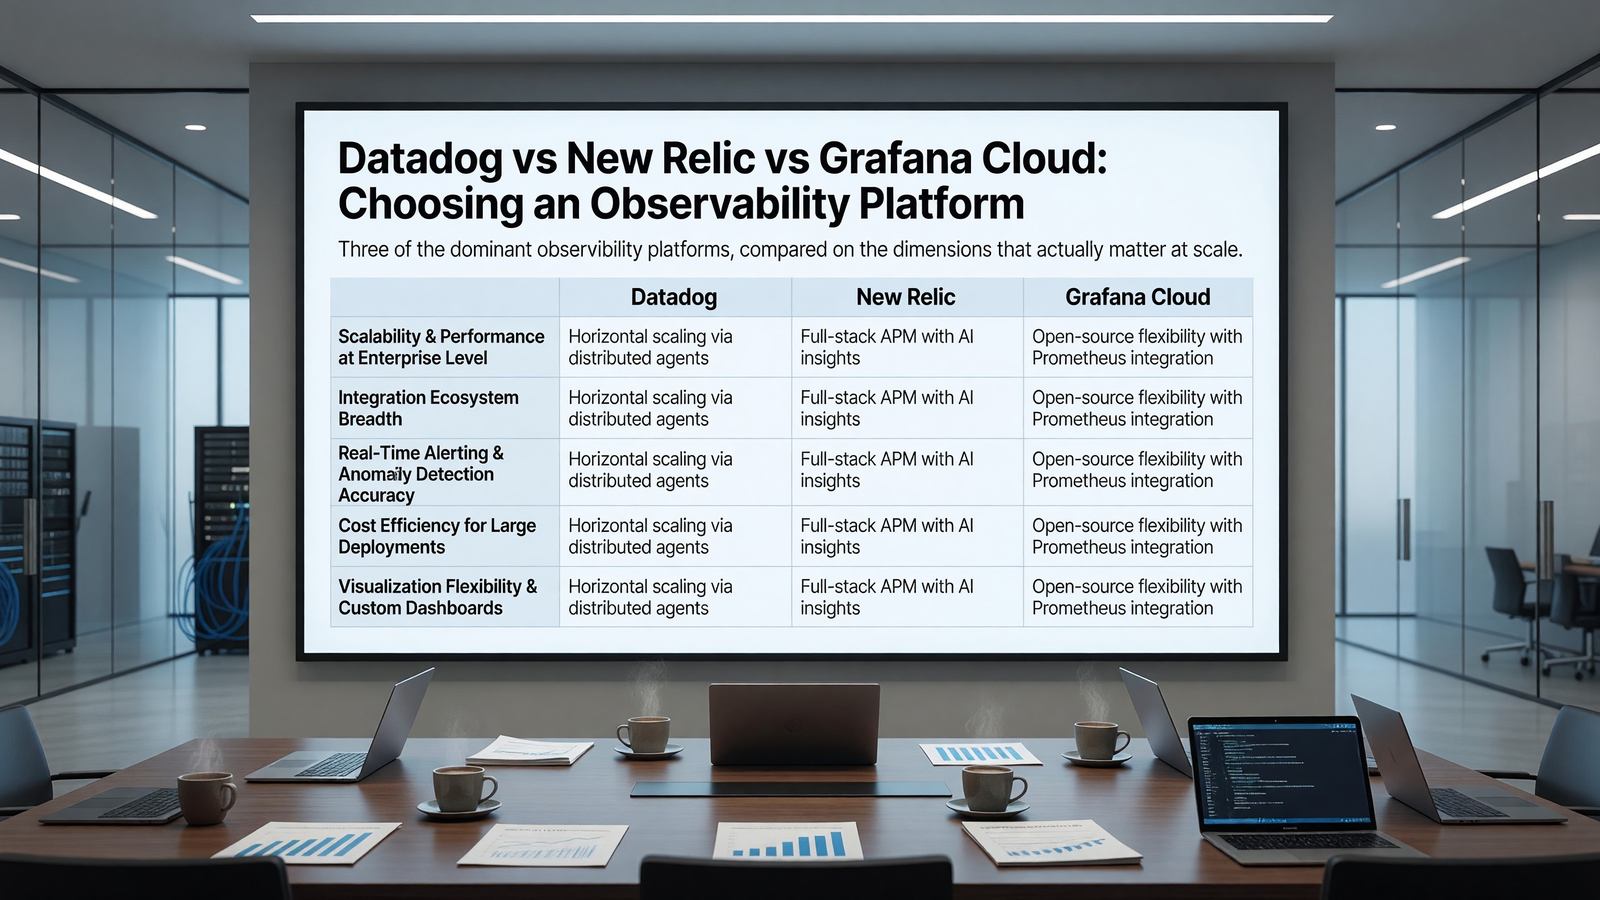
Datadog, New Relic, and Grafana Cloud cover roughly the same surface area: metrics, logs, traces, application performance monitoring, and an alerting layer on top. The differences are in pricing model, feature depth, and the philosophy each platform brings.
Datadog leads on breadth and polish. New Relic has been rebuilding around its observability platform after years of focusing on APM. Grafana Cloud is the open-source-friendly option built on Prometheus, Loki, Tempo, and Mimir.
Datadog
Datadog’s strengths are the consistency of the experience across pillars and the depth of out-of-the-box integrations. Metrics, logs, traces, and synthetic monitoring all share a common navigation model and correlate cleanly.
The weakness is cost. Datadog’s per-host, per-feature pricing model gets expensive fast. Hosts with autoscaled containers can rack up surprising bills. Log volume in particular needs active management.
New Relic
New Relic’s pricing pivot to consumption-based (per GB ingested and per user) was a significant shift. For many workloads it’s cheaper than Datadog; for high-volume log shops it can be more expensive.
The platform is solid on APM, where New Relic has long been strong. Infrastructure monitoring and log management have improved but aren’t as polished as Datadog. Newer features (vulnerability management, AI monitoring) are competitive but not differentiated.
Grafana Cloud
Grafana Cloud is the managed version of the open-source Grafana stack: Prometheus-compatible metrics (via Mimir), Loki for logs, Tempo for traces, and Grafana for visualization.
Strengths: open standards (OpenTelemetry-native, PromQL, LogQL), no lock-in (you can self-host the same components), and competitive pricing for organizations that can self-instrument with OpenTelemetry. Weakness: more assembly required than the all-in-one platforms; the UX is improving but isn’t as cohesive as Datadog.
How to Choose
Choose Datadog if breadth, polish, and a fully integrated experience matter more than cost — and if you’re prepared to invest in cost discipline.
Choose New Relic if APM is your primary use case and you want consumption-based pricing that scales with usage, not host count.
Choose Grafana Cloud if you want open-standards observability, OpenTelemetry-native data flow, and the option to self-host parts of the stack. Smaller teams with platform engineering capacity often land here.
Related Reading
- See our deeper guide at /devops/monitoring-with-prometheus-grafana/.
Cost Management Strategies
Whatever platform you choose, cost discipline is the largest difference between teams that are happy with their observability bill and teams that aren’t. Tag-based attribution helps — every service knows its observability cost. Metric cardinality reviews catch the high-cost outliers before they hit the bill.
Log volume is the line item most teams underestimate. A noisy service can generate gigabytes per day. Sampling, tier-based retention (hot tier short, cold tier long), and aggressive filtering at the agent level all bring it down.
Migrating Between Platforms
Migration is more painful than expected, primarily because dashboards and alerts have been built up over years and don’t transfer between platforms cleanly. PromQL queries can move between Prometheus-compatible backends; dashboards built on platform-specific query languages have to be rewritten.
If you anticipate ever migrating, instrument with OpenTelemetry and use Prometheus-compatible query languages where possible. The portability cost upfront pays back if you ever need to move.
Distributed Tracing Capabilities
All three platforms support distributed tracing. The differences are in trace ingestion limits, sampling strategies, and query capabilities. Datadog has the most mature trace search UI; Honeycomb is the gold standard but is a separate evaluation.
Tail-based sampling decisions (made after the trace completes) catch all error traces and slow traces while sampling normal traffic. Both Datadog and Grafana Cloud support this; New Relic’s implementation is more limited.
For services with millions of requests per minute, sampling strategy matters as much as platform choice. Default head-based sampling at 100% will bankrupt you; aggressive head-based sampling misses the traces you most want to see.
RUM and Frontend Observability
Real User Monitoring (RUM) instruments frontend code to capture page loads, user interactions, and JavaScript errors. All three platforms have RUM offerings; the integration depth with backend tracing varies.
Datadog’s RUM correlates clicks with backend traces tightly. New Relic’s Browser product is mature but separate from APM in places. Grafana’s Faro is newer and improving.
For organizations that care about full user-journey observability, evaluate frontend-backend correlation specifically. Many setups have great backend metrics and no idea what users actually experience.
Productivity and Developer Experience
Developer experience research consistently finds that small friction adds up. The minute spent every time you switch tasks because the tool is slow, the moment of confusion every time a command doesn’t work as expected — these compound across days and weeks.
The investment in good tooling pays back. Engineers with well-tuned environments routinely outperform engineers in default environments by meaningful margins, especially on tasks that involve switching context or doing repetitive actions.
Standardize where it helps (shared dotfiles, dev container baselines, agreed-on tool choices) and let individuals customize where it doesn’t (editor preferences, prompt designs, keyboard layouts). The right balance varies by team.
Adoption and Onboarding
New tools succeed or fail in onboarding. A tool with great long-term value but a steep initial curve gets abandoned before the value materializes. A tool with limited value but smooth onboarding becomes the default forever.
Successful tool adoption usually includes: an internal champion who’s already proficient, paired learning sessions for newcomers, and explicit time set aside for the learning curve.
Forcing adoption without these supports doesn’t work. Engineers who feel forced revert to familiar tools as soon as oversight ends. Voluntary adoption with good support generates lasting change.
Tool Evaluation Process
New developer tools arrive constantly. Without a process for evaluation, teams either adopt every shiny new thing or rigidly reject change. Both extremes hurt.
A working evaluation process: small pilot with one or two engineers, sharing of findings, broader trial if the pilot succeeds, decision point on team-wide adoption. The full cycle takes weeks to months depending on tool scope.
Document the why behind tool choices. The tools change; the reasoning often persists. Future evaluators benefit from understanding what was tried and what didn’t work.
Personal Setup and Sharing
Each engineer’s personal setup evolves over years. The best setups combine team-standard tools with personal customizations that match individual working styles.
Sharing setups within the team accelerates everyone. A monthly ‘show your setup’ session, internal blog posts on tooling discoveries, or pair-programming where engineers see each other’s environments all transfer tacit knowledge.
Dotfile repositories with documentation make this concrete. Teams that share their environments openly find that productivity gains spread organically across the group.
Building Your Setup Over Time
Developer tooling evolves continuously. The setup that worked two years ago has gaps now; the setup that’s perfect today will feel dated in two years. Treating personal tooling as an ongoing investment, not a one-time setup, yields the best long-term results.
Practical rhythm: review and update tooling every six months. Try one new tool each quarter. Document what works for your own future reference. The accumulated experimentation builds a setup that fits your actual workflows.
The community matters here too. Tool authors and power users share insights via blog posts, conference talks, and social media. Following a few voices in your tooling space surfaces ideas you’d otherwise miss.
Most importantly, optimize for your actual work, not for theoretical best practices. The tools that other engineers love may not fit your style; that’s fine. The goal is making your daily work flow better, not adopting trends.
The compounded effect of small tooling improvements over a career is significant. The investment now pays back for years to come.
Frequently Asked Questions
Is Datadog really that expensive?
At scale, yes. Teams with strong cost discipline can keep it manageable. Teams without discipline see 5x cost growth in a year.
Can I use OpenTelemetry with all three?
Yes. All three accept OTel data. Grafana Cloud is the most OTel-native; Datadog and New Relic accept it but route through their own agents for advanced features.
What about Honeycomb, Lightstep, and SigNoz?
Honeycomb is excellent for traces and event-based observability. Lightstep (now part of ServiceNow) targets distributed tracing at scale. SigNoz is open-source and worth evaluating for self-hosted setups.
Should I self-host?
If you have platform engineering capacity and predictable workloads, yes. If you don’t, the operational tax of self-hosting Prometheus + Loki + Tempo at scale is real.