SLOs, SLAs, and SLIs Explained: Building a Reliability Framework
The Three Acronyms
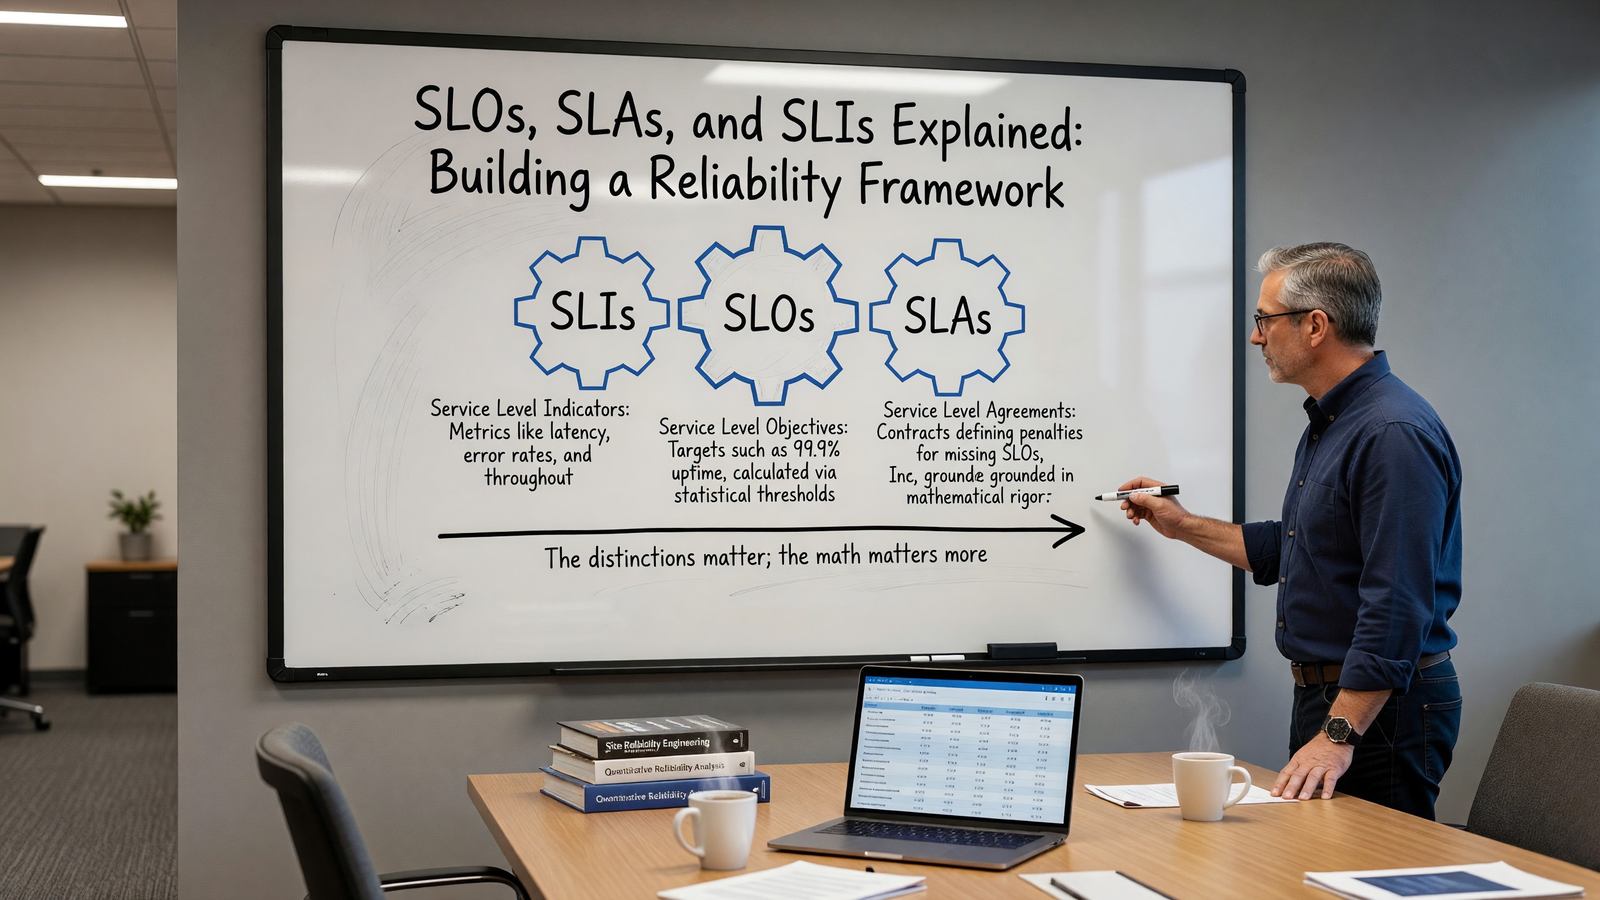
SLI (Service Level Indicator): a quantitative measure of a service. Examples: percentage of requests with latency under 200ms, percentage of successful requests, percentage of writes that durably persisted. The SRE workbook chapter on SLOs is the most practical reference for implementation.
SLO (Service Level Objective): a target for an SLI over a window. ‘p99 latency under 200ms for 99.9% of requests measured over 28 days.’
SLA (Service Level Agreement): a contractual SLO with consequences (refunds, credits) for missing it. SLAs are SLOs negotiated with customers; they almost always have wider tolerances than the internal SLOs that drive engineering.
Picking SLIs That Matter
Good SLIs measure user experience, not system internals. ‘CPU utilization’ is a system metric, not an SLI. ‘Percentage of API requests completing under 500ms’ is closer to an SLI.
The standard pattern is the user journey: identify the critical paths a user takes through your service and measure each. Login flow, checkout flow, search flow. Each gets its own SLI.
Error Budgets
An SLO defines an error budget: the amount of unreliability the team is willing to accept. A 99.9% SLO over 28 days allows roughly 40 minutes of error per month. Use the budget for risk-taking — deployments, feature launches, experiments. The DORA research ties SLO-based reliability practices to organizational performance outcomes.
When the budget is exhausted, the team’s posture shifts toward reliability work. Pause risky deployments, prioritize fixing reliability debt. When the budget is healthy, ship faster.
Burn Rate Alerts
Don’t alert when an SLO has been violated. Alert when the error budget is burning at a rate that threatens it. A burn rate of 14.4x consumes a 30-day budget in two days; a burn rate of 6x consumes it in five days.
Multi-window, multi-burn-rate alerts (fast-burn and slow-burn) are the modern pattern. They catch sudden incidents and gradual degradation with appropriate urgency for each.
Common Failure Modes
SLOs that nobody enforces are theater. If burning through the budget doesn’t actually change behavior, the SLO isn’t doing anything.
SLOs set too high (99.999%) inflate the cost of every change. SLOs set too low (99%) don’t constrain risky changes enough. Most consumer-facing services land at 99.9% or 99.95%.
Related Reading
- See our deeper guide at /devops/sre-on-call-best-practices/.
SLO Targets and Reality
The temptation is to set SLO targets at ‘four nines’ (99.99%) because more nines sounds better. The reality: each additional nine increases the cost of every change.
Pick the lowest reliability target that meets actual user needs. Most consumer services don’t notice the difference between 99.9% and 99.99% availability. Most B2B platforms with negotiated SLAs operate well below 99.99%. Honest target-setting is cheaper and easier to sustain.
Customer-Facing SLAs
Customer-facing SLAs need to be looser than internal SLOs. The internal SLO is the target the team is engineering toward; the SLA is the commitment you can defend in court.
Standard pattern: internal SLO at 99.95%, customer SLA at 99.9%. The buffer absorbs measurement variance and gives you room to fix issues before they breach the SLA. Customers see consistent reliability; the team has realistic targets to drive engineering decisions.
Implementation in Different Platforms
SLOs in Prometheus are the most flexible. Define SLIs as PromQL expressions, recording rules compute them, alert rules fire on burn rate. The slo-libsonnet library and the Pyrra and Sloth projects automate SLO management on top of Prometheus.
Datadog, New Relic, and Grafana Cloud all have native SLO features. They’re more polished than rolling your own; they cost more. Evaluate based on your existing observability platform investment.
For organizations new to SLOs, starting with Prometheus and either Pyrra or Sloth offers the right balance of capability and learning. Move to a hosted SLO platform later if the operational overhead doesn’t fit.
Common SLO Mistakes
Setting too many SLOs. The point of SLOs is focus — what really matters. A team with 50 SLOs has effectively no SLOs because nobody can keep them in mind.
Setting SLOs based on what you wish were true, not what’s actually achievable. SLO targets should reflect engineering reality with a small stretch. Aspirational targets that the team has no path to hit destroy SLO credibility.
Treating SLO burn as a performance metric. Burn rate is a signal, not a score. Teams that get punished for SLO burn learn to either game the metric or avoid taking risks that would inform the burn.
Team Culture and Practices
The tooling matters; the culture matters more. Teams with strong DevOps practices and middling tools usually outperform teams with state-of-the-art tools and weak culture.
Core practices: shared ownership of production reliability, blameless incident response, regular retrospectives, deliberate investment in developer experience. None require specific tools; all require sustained leadership attention.
Maturity grows gradually. A team that adopts blameless postmortems but still has weekly all-hands-on-deck deployments hasn’t internalized the practice. Watch the behaviors during stress, not the documented procedures.
Continuous Improvement Cadence
The DevOps movement’s emphasis on continuous improvement isn’t a slogan; it’s a practical requirement. Systems decay, requirements change, and tools age. Maintaining a healthy engineering organization requires deliberate, ongoing investment.
Quarterly retrospectives at the team and organization level surface what’s working and what isn’t. The output is concrete commitments to change — not abstract aspirations.
Track changes from retrospectives. Teams that don’t follow through on retrospective actions eventually stop running retrospectives. Demonstrated follow-through builds the trust that makes future retrospectives valuable.
Hiring and Team Building
DevOps and platform engineering hiring is competitive. The job market pays well; experienced engineers are in demand. Building teams requires investment in both compensation and culture.
What attracts strong candidates: meaningful work on systems they can directly impact, clear ownership boundaries, modern tooling, sustainable on-call practices, growth opportunities. What drives them away: legacy systems with no migration plan, unclear ownership, oppressive on-call, no investment in their growth.
Internal mobility matters too. Engineers in adjacent disciplines (backend development, networking, security) often become strong platform engineers with appropriate support. Building hiring pipelines that include internal transfers expands the talent pool.
Vendor Selection and Tool Procurement
DevOps organizations buy many tools. Each tool selection is a multi-year commitment with implicit ongoing costs (licenses, training, integration). The selection process deserves more attention than it usually gets.
Standard evaluation criteria: feature fit, total cost of ownership over three years, exit cost (how hard is it to migrate away later), vendor stability, and integration with existing tooling.
Avoid the trap of evaluating only on features in initial demos. The features matter; so do the rough edges that surface in week three of actual use. Trial periods and reference customers in similar environments surface what marketing doesn’t.
Practical Next Steps
For teams beginning their DevOps or platform engineering journey, the temptation is to adopt every recommended practice at once. The teams that succeed tend to focus on one or two specific improvements at a time, build the habit, and then expand scope.
Concrete next steps worth considering: instrument deployment frequency and lead time, even informally. Run a blameless retrospective after the next incident. Document the platform decisions that have been made implicitly. Survey the team about pain points and tackle the top two.
Each of these is a small investment with compounding returns. The team that runs retrospectives quarterly accumulates institutional learning that the team without them doesn’t. The team that tracks DORA metrics over a year sees trends they would otherwise miss.
The work doesn’t end. Engineering organizations are living systems that decay without active maintenance. The practices described throughout this article are tools for sustained improvement, not destinations to reach and stop.
Frequently Asked Questions
Where do I start?
Pick one critical user journey, define an SLI for it, set an SLO at the level of reliability you actually need. Measure for a quarter. Refine.
How do I pick the right target?
Look at historical data. Current actual reliability is a strong baseline. Going much above what you currently deliver is expensive.
Should every service have an SLO?
Critical user-facing services, yes. Internal services with low blast radius, less urgent. Don’t drown the team in SLOs that nobody uses.
How do I implement burn rate alerts?
Prometheus’s recording rules and Alertmanager support multi-window burn rate alerts cleanly. SRE Workbook documents the canonical patterns.