Canary Deployments on Kubernetes: Controlling Rollout Risk
The Canary Pattern
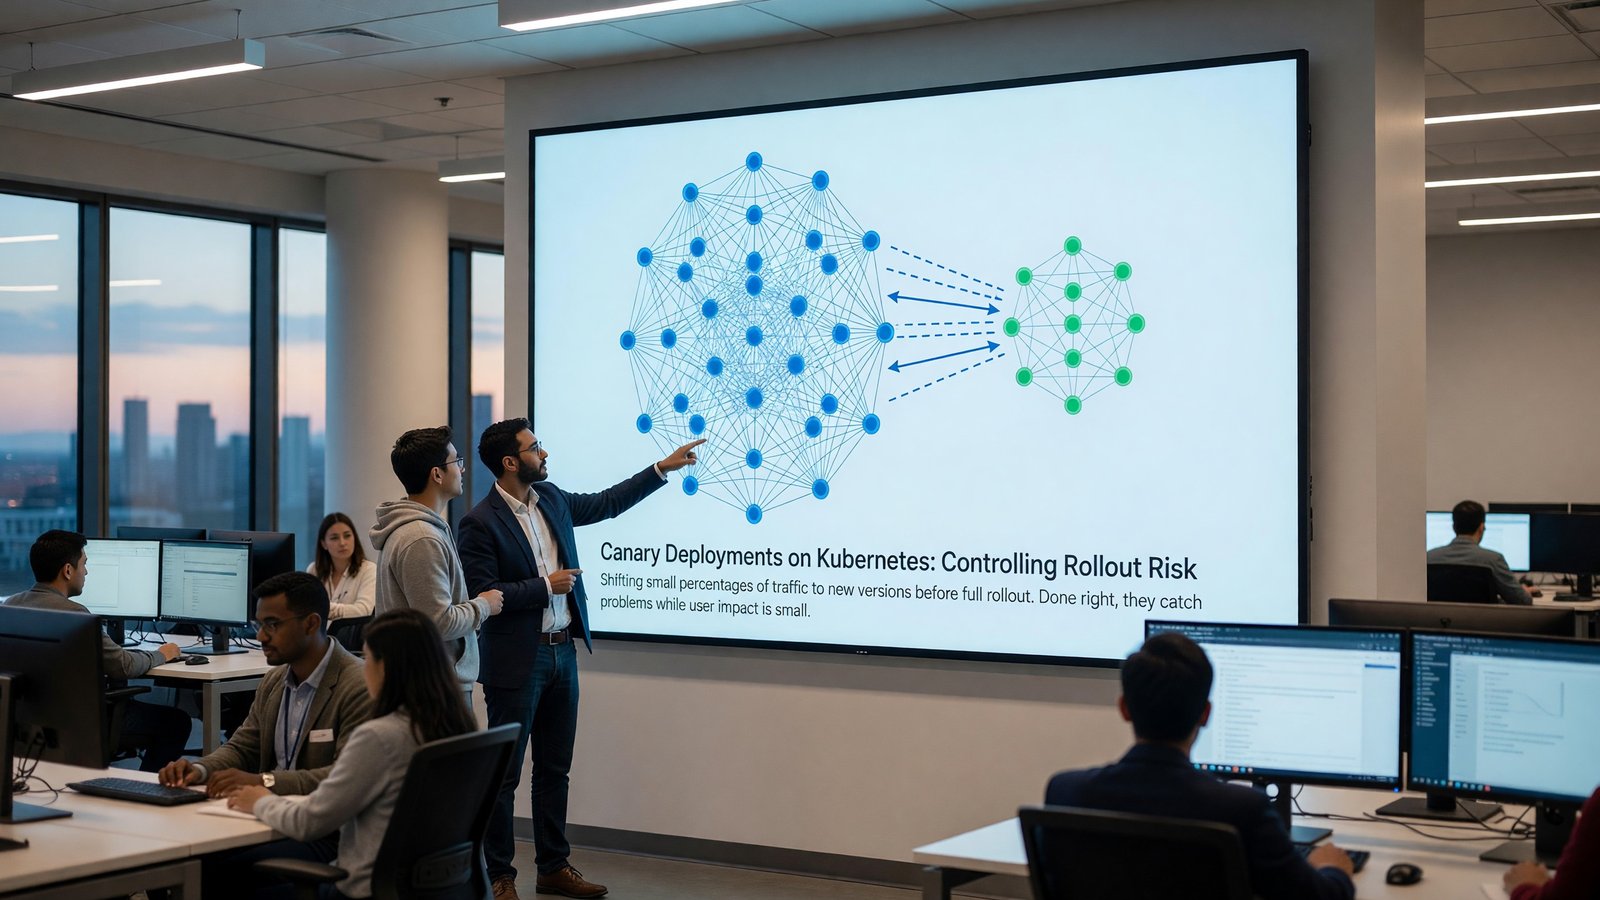
A canary deployment runs the new version of a service alongside the old one. A small percentage of traffic — 1%, 5%, 10% — goes to the canary. If metrics stay healthy, the percentage increases until the canary is serving all traffic. If metrics regress, traffic shifts back.
The pattern works best for stateless services with measurable health signals (latency, error rate, business metrics). It works poorly for batch jobs, services without good metrics, or services where any failed request has serious consequences.
Traffic Shifting Mechanisms
Three layers can do the shifting: a service mesh (Istio, Linkerd), an ingress controller with canary support (NGINX Ingress, Traefik), or a dedicated progressive delivery tool (Argo Rollouts, Flagger).
Service meshes give the most flexible traffic policies but require running a mesh. Ingress-level canary is simpler but coarser. Dedicated tools like Argo Rollouts give Kubernetes-native CRDs that integrate cleanly with GitOps workflows.
What Signals to Watch
The canary’s health is judged against the baseline. Compare request rate, error rate, and latency between canary pods and baseline pods over a representative period (5-15 minutes per step is typical).
Don’t compare canary to historical baseline. Traffic patterns shift; the only fair comparison is current canary vs current baseline. Tools like Flagger automate this with built-in Prometheus queries.
Step Durations and Promotion Logic
A canary at 5% for 10 minutes will only catch problems that show up in that traffic and that time. Longer steps catch more, slower. Shorter steps deploy faster, riskier.
Typical schedule: 5% for 10 minutes, 25% for 10 minutes, 50% for 10 minutes, 100%. Adjust for your risk tolerance and traffic volume — high-traffic services can canary faster because samples accumulate quickly.
When Canary Goes Wrong
Failure modes worth knowing: not enough traffic to the canary for statistical significance, header-based routing that doesn’t match real user patterns, missing health metrics that let bad canaries promote, and database schema changes that constrain canary value because both versions share state.
Canary deployments aren’t a substitute for staging environments or integration tests. They catch problems that only show up under real traffic — which is meaningful but limited.
Related Reading
- See our deeper guide at /cicd/blue-green-deployment-guide/.
Argo Rollouts in Practice
Argo Rollouts replaces the standard Kubernetes Deployment with a Rollout CRD that supports canary, blue-green, and progressive delivery natively. The CRD spec includes weights, pause conditions, and analysis steps.
The analysis step is the differentiator. AnalysisTemplates run during the canary phase and compare metrics (latency, error rate, custom Prometheus queries) between canary and stable replicas. If analysis fails, the rollout auto-aborts. This is the difference between ‘canary’ and ‘percentage deployment with humans watching.’
Feature Flags vs Canary
Canary deployments control which infrastructure runs which code. Feature flags control which users see which functionality. They solve different problems and combine well.
Canary first: deploy the new version to 5% of infrastructure, verify it’s healthy. Feature flag second: enable the new feature for 1% of users on that infrastructure, measure business impact. The two-layer approach lets you separate ‘does the code work’ from ‘is the feature worth shipping.’
Header-Based Routing for Internal Validation
Before exposing canary traffic to real users, internal validation with header-based routing isolates testing from real-user impact. A specific HTTP header (X-Canary: true) routes to the canary version; engineers test by setting the header.
This works for internal services and admin pages. For consumer-facing services, the assumption that internal users represent real traffic patterns rarely holds — internal users do different things than customers.
Header-based testing is a precursor to percentage rollout, not a replacement. Use it to validate basic functionality before exposing the canary to real users.
Statistical Significance and Sample Size
A canary at 5% of traffic for 5 minutes might see only a few hundred requests. That’s not enough data to detect a 1% increase in error rate; the noise floor is higher than the signal.
The minimum useful sample size depends on what you’re measuring. Detecting changes in metrics that vary widely (latency p99, conversion rate) requires more samples than detecting changes in stable metrics (overall error rate).
Tools like Argo Rollouts and Flagger handle this implicitly via analysis templates with Prometheus queries. Define the queries thoughtfully — comparison windows that are too short lead to false canary promotions or false failures.
Release Notes and Changelog Generation
Automated release notes from commit history close the loop between code changes and user-facing communication. Tools like release-drafter, semantic-release, and changesets generate changelogs from conventional commits or PR labels.
The discipline of writing PR titles and commit messages for downstream consumption pays back here. PR titles become changelog entries; clear titles make for clear changelogs.
For libraries with external users, automated semver bumping based on commit type (feat: minor, fix: patch, breaking change: major) reduces manual version management. The same tooling can publish to npm, PyPI, or other package registries on merge.
Security in CI/CD
CI/CD systems hold significant power: they can build code, sign images, push to registries, and deploy to production. Securing them matters.
Standard hardening: least-privilege credentials for each step, signed artifacts at each stage, audit logs of all pipeline executions, separation between build environments and production credentials.
Supply chain attacks via compromised CI are a real and growing threat. SLSA (Supply chain Levels for Software Artifacts) provides a framework for thinking about CI/CD security maturity. Most organizations land at SLSA level 1-2; reaching level 3 requires real investment but provides meaningful guarantees.
Pipeline Templating and Reuse
At scale, copy-pasted CI configuration becomes a maintenance burden. Every change to the standard pipeline requires touching dozens of repos.
Templating mechanisms vary by platform: GitHub Actions composite actions and reusable workflows, GitLab CI includes and templates, Jenkins shared libraries. Each provides a path to defining pipeline logic once and consuming it from many repositories.
The pattern that works: a small platform team maintains pipeline templates; service teams consume them by reference. Service-specific customization happens via variables and minimal local overrides. Template changes can be reviewed and tested centrally before propagating.
Build Cache and Performance
Build performance compounds at scale. A 30-second improvement on every pipeline run translates to hours per day across an organization.
Caching strategies matter most: dependency caches (npm, Maven, pip), Docker layer caches, intermediate build artifacts. Each cache type has different invalidation rules and storage requirements.
Remote caches shared across runners deliver the biggest improvement for monorepos and matrix builds. Bazel remote cache, Turborepo Remote Cache, and Nx Cloud all provide this for their respective ecosystems. Build times that dropped from 10 minutes to 1 minute aren’t unusual.
Putting It Into Practice
The patterns described throughout this article aren’t all equally important for every team. The right starting point depends on current state.
For teams without consistent CI/CD: focus first on basic pipeline reliability and speed. Inconsistent or slow pipelines undermine every other improvement you might try later.
For teams with working pipelines but high change failure rate: invest in better testing, smaller deployments, and explicit rollback procedures. The shift from ‘shipping is scary’ to ‘shipping is routine’ transforms how teams operate.
For teams with reliable CI/CD looking to advance: progressive delivery, deployment frequency improvement, and DORA metric tracking are the natural next steps. Each builds on the foundation rather than replacing it.
The advancement isn’t linear, and not every team needs every capability. Match the practices to the team’s actual constraints and let the rest wait.
Frequently Asked Questions
Canary vs blue-green?
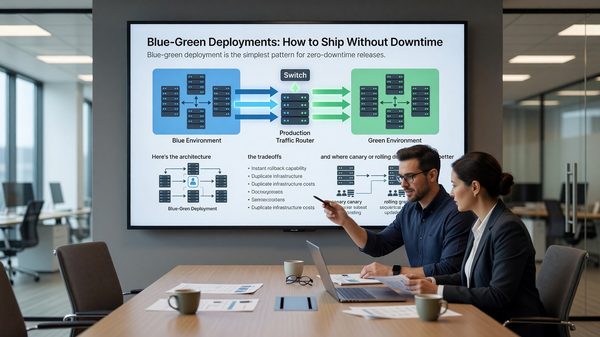
Canary gradually shifts traffic with health checks. Blue-green is an atomic switch. Use canary for risky changes; use blue-green when atomic cutover is what you need.
Do I need a service mesh for canary?
No. Argo Rollouts works without a mesh by manipulating service selectors or using ingress controllers.
How long should each canary step be?
5-15 minutes is typical. Long enough for enough traffic to surface issues, short enough that the full rollout completes in reasonable time.
What if I can’t measure error rates per pod?
Then canary doesn’t help you. Fix the observability first.